
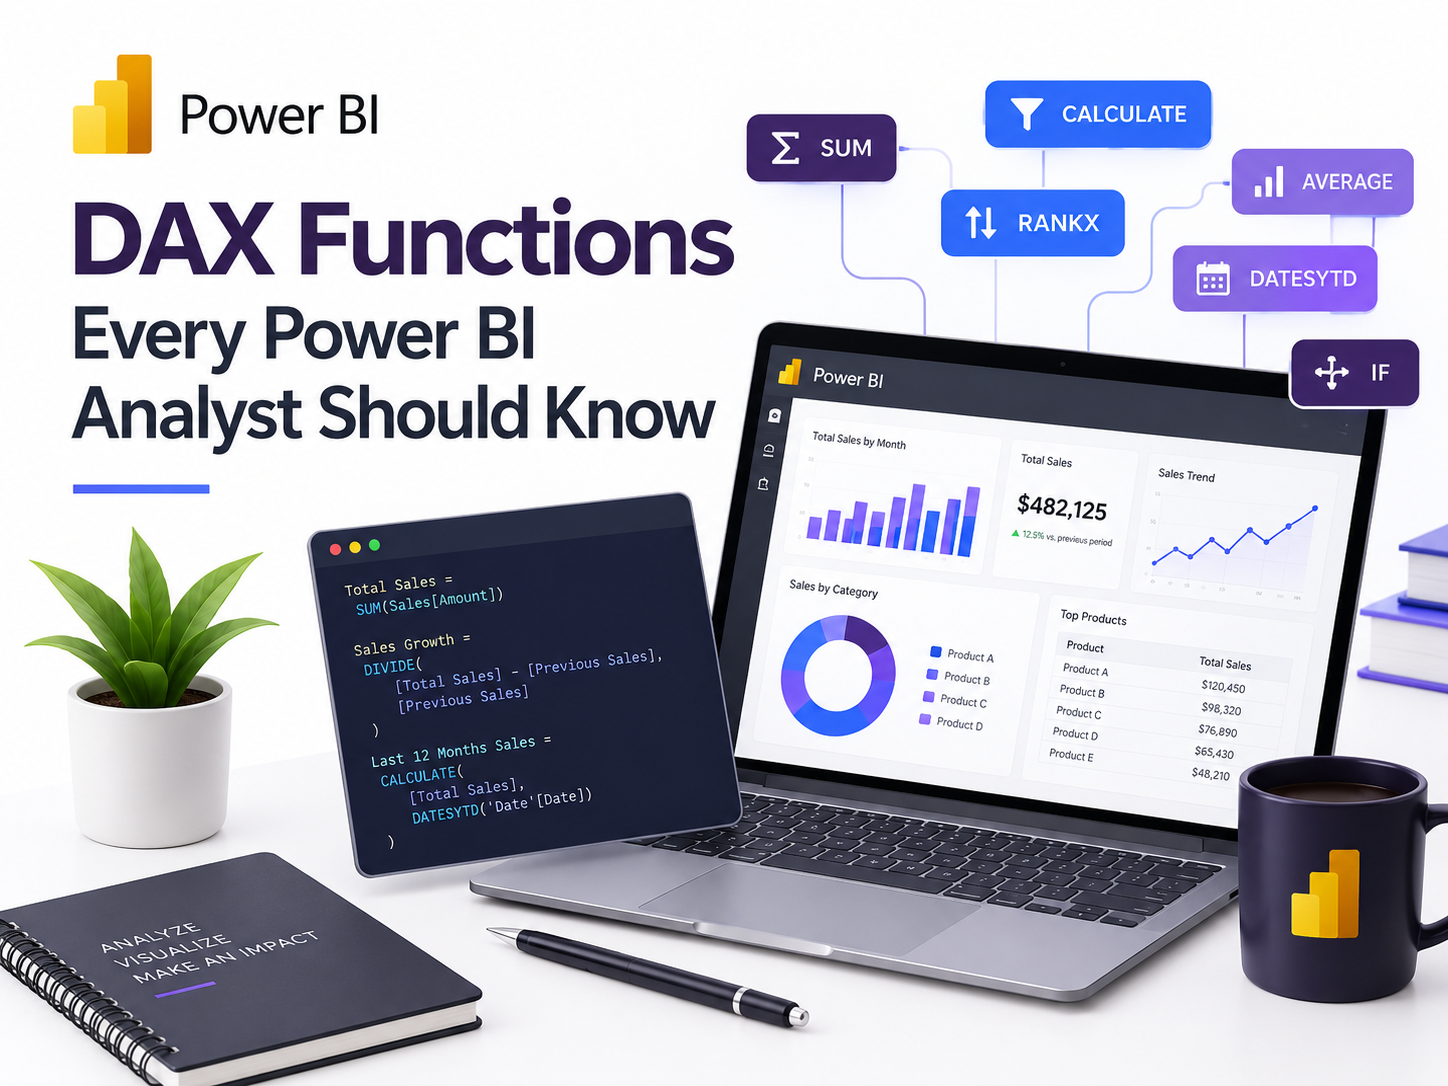
If you have ever built a chart in Power BI and thought, “I wish I could show this number a different way,” you are ready to learn DAX. The DAX functions every Power BI analyst should know are the building blocks behind almost every useful report, from simple totals to year-over-year growth.
DAX stands for Data Analysis Expressions. It is the formula language used in Power BI, Excel Power Pivot, and SQL Server Analysis Services. If you already write Excel formulas, you will feel right at home. Many DAX functions even share names with Excel functions like SUM, IF, and AVERAGE.
For a beginner data analyist, this skill is a real career boost. Clients love dashboards. Knowing how to turn raw website traffic, sales, or form data into clear numbers makes you far more valuable than someone who only builds pages. A good Power BI report can show which pages bring in leads, which campaigns pay off, and where visitors leave.
This guide breaks down the most important DAX functions in plain language. You will learn what each one does, when to use it, and see a short example you can copy. No advanced math or coding background is needed.
What Is DAX in Power BI?
DAX is a formula language that lets you create new calculations from the data you already loaded. You write a formula, and Power BI works out the answer for every chart, table, and filter on your report.
Think of it like Excel formulas, with one big upgrade. DAX formulas react to your report. When a viewer clicks “2025” on a slicer, your formula recalculates for 2025 only. You write it once, and it works everywhere.
Calculated Columns vs. Measures
Before you write any formula, you need to know where it lives. DAX has two main types:
- Calculated columns add a new column to a table. They are calculated row by row when data loads.
- Measures calculate on the fly, based on what is shown in your report. They are used for totals, averages, and ratios.
As a rule of thumb, use a measure when you want a number to summarize data. Use a calculated column when you need a new value for each row, such as a category label. Most of the functions below work best inside measures.
Basic Aggregation Functions
These are the first DAX functions you will use. They work like the totals in an Excel pivot table.
SUM
SUM adds up all the values in one column.
Total Sales = SUM(Sales[Amount])
This is the simplest measure you can write, and you will use it constantly.
AVERAGE
AVERAGE finds the mean of a column.
Average Order Value = AVERAGE(Sales[Amount])
COUNT, COUNTROWS, and DISTINCTCOUNT
Counting is a huge part of data analysis. Each counting function answers a slightly different question:
- COUNT counts the numbers in a column.
- COUNTROWS counts the rows in a table.
- DISTINCTCOUNT counts unique values only.
Number of Orders = COUNTROWS(Sales)
Unique Customers = DISTINCTCOUNT(Sales[CustomerID])
DISTINCTCOUNT is a favorite. If one customer buys five times, they still count as one unique customer.
MIN and MAX
MIN and MAX return the smallest and largest values in a column. They are handy for finding the first or last order date.
Latest Order = MAX(Sales[OrderDate])
The Most Powerful DAX Function: CALCULATE
If you only learn one function from this article, make it CALCULATE. It lets you change the filters on a calculation. Most advanced DAX builds on it.
Online Sales = CALCULATE(SUM(Sales[Amount]), Sales[Channel] = "Online")
Here is how to read it:
- The first part,
SUM(Sales[Amount]), is the calculation. - The second part,
Sales[Channel] = "Online", is the filter. - Together, they mean “add up sales, but only for online orders.”
With CALCULATE you can compare a part to the whole. For example, you can show online sales next to total sales in the same chart.
FILTER
FILTER returns only the rows that meet a condition. It is often used inside CALCULATE when your rule is more complex.
Big Orders = CALCULATE(COUNTROWS(Sales), FILTER(Sales, Sales[Amount] > 500))
This counts only orders over $500.
ALL
ALL removes filters. This sounds odd, but it is how you calculate percentages of a total. Without ALL, every slicer would shrink your “total” too.
Percent of All Sales = DIVIDE(SUM(Sales[Amount]), CALCULATE(SUM(Sales[Amount]), ALL(Sales)))
Logical Functions for Smart Decisions
Logical functions let your report make choices, just like in Excel.
IF
IF checks a condition and returns one of two answers.
Sales Status = IF(SUM(Sales[Amount]) >= 10000, "On Target", "Below Target")
SWITCH
When you have many conditions, nested IF formulas get messy. SWITCH is cleaner and easier to read.
Size Label =
SWITCH(
    TRUE(),
    Sales[Amount] >= 1000, "Large",
    Sales[Amount] >= 500, "Medium",
    "Small"
)
DIVIDE
DIVIDE is a safer way to divide. If the bottom number is zero, a normal division gives an error. DIVIDE returns a blank instead, or a value you choose.
Conversion Rate = DIVIDE([Orders], [Visitors], 0)
Use DIVIDE for every ratio you build. It keeps your dashboards clean.
Time Intelligence Functions
Time intelligence is where DAX really shines. These functions help you compare dates, which is something every business wants. To use them, your model needs a proper date table with no gaps.
TOTALYTD
TOTALYTD gives you a running total since the start of the year.
Sales YTD = TOTALYTD(SUM(Sales[Amount]), 'Date'[Date])
SAMEPERIODLASTYEAR
This function shifts dates back by one year, so you can compare this year to last year.
Sales Last Year = CALCULATE(SUM(Sales[Amount]), SAMEPERIODLASTYEAR('Date'[Date]))
DATEADD
DATEADD moves dates forward or backward by days, months, quarters, or years. It is more flexible than SAMEPERIODLASTYEAR.
Sales Last Month = CALCULATE(SUM(Sales[Amount]), DATEADD('Date'[Date], -1, MONTH))
With two measures, you can now build a year-over-year growth formula:
YoY Growth = DIVIDE([Total Sales] - [Sales Last Year], [Sales Last Year])
Text and Relationship Functions
A few more functions are worth knowing early.
- CONCATENATE or the
&symbol joins text together, such as first and last names. - RELATED pulls a value from another table, like a product name into a sales table.
- LEFT, RIGHT, and FORMAT clean up and style text and dates.
Full Name = Customers[FirstName] & " " & Customers[LastName]
Tips for Learning DAX Faster
DAX can feel strange at first. These habits will help:
- Start small. Build one simple measure, then add to it.
- Use variables. The
VARandRETURNkeywords make long formulas easier to read. - Name measures clearly. “Total Sales” beats “Measure 1” every time.
- Format your code. Put each part of a long formula on its own line.
- Practice with real data. Try your own website analytics or a free sample dataset.
Conclusion
Learning the DAX functions every Power BI analyst should know is one of the fastest ways to level up your data skills. You do not need to memorize hundreds of formulas. A small core set will cover most of what you build.
Here is a quick recap of what you learned:
- SUM, AVERAGE, COUNTROWS, and DISTINCTCOUNT handle everyday totals and counts.
- CALCULATE changes filters and unlocks advanced analysis.
- FILTER and ALL give you control over exactly which rows are counted.
- IF, SWITCH, and DIVIDE add logic and keep results error-free.
- TOTALYTD, SAMEPERIODLASTYEAR, and DATEADD make date comparisons simple.
Your next step is to open Power BI Desktop and try them. Load a small dataset, write a SUM measure, then wrap it in CALCULATE. Small wins build confidence quickly.
For a beginner data analyst, these skills open real doors. You can offer clients more than a good-looking site. You can show them what the numbers say and help them make better choices. Keep practicing, stay curious, and soon the DAX functions every Power BI analyst should know will feel like second nature.