
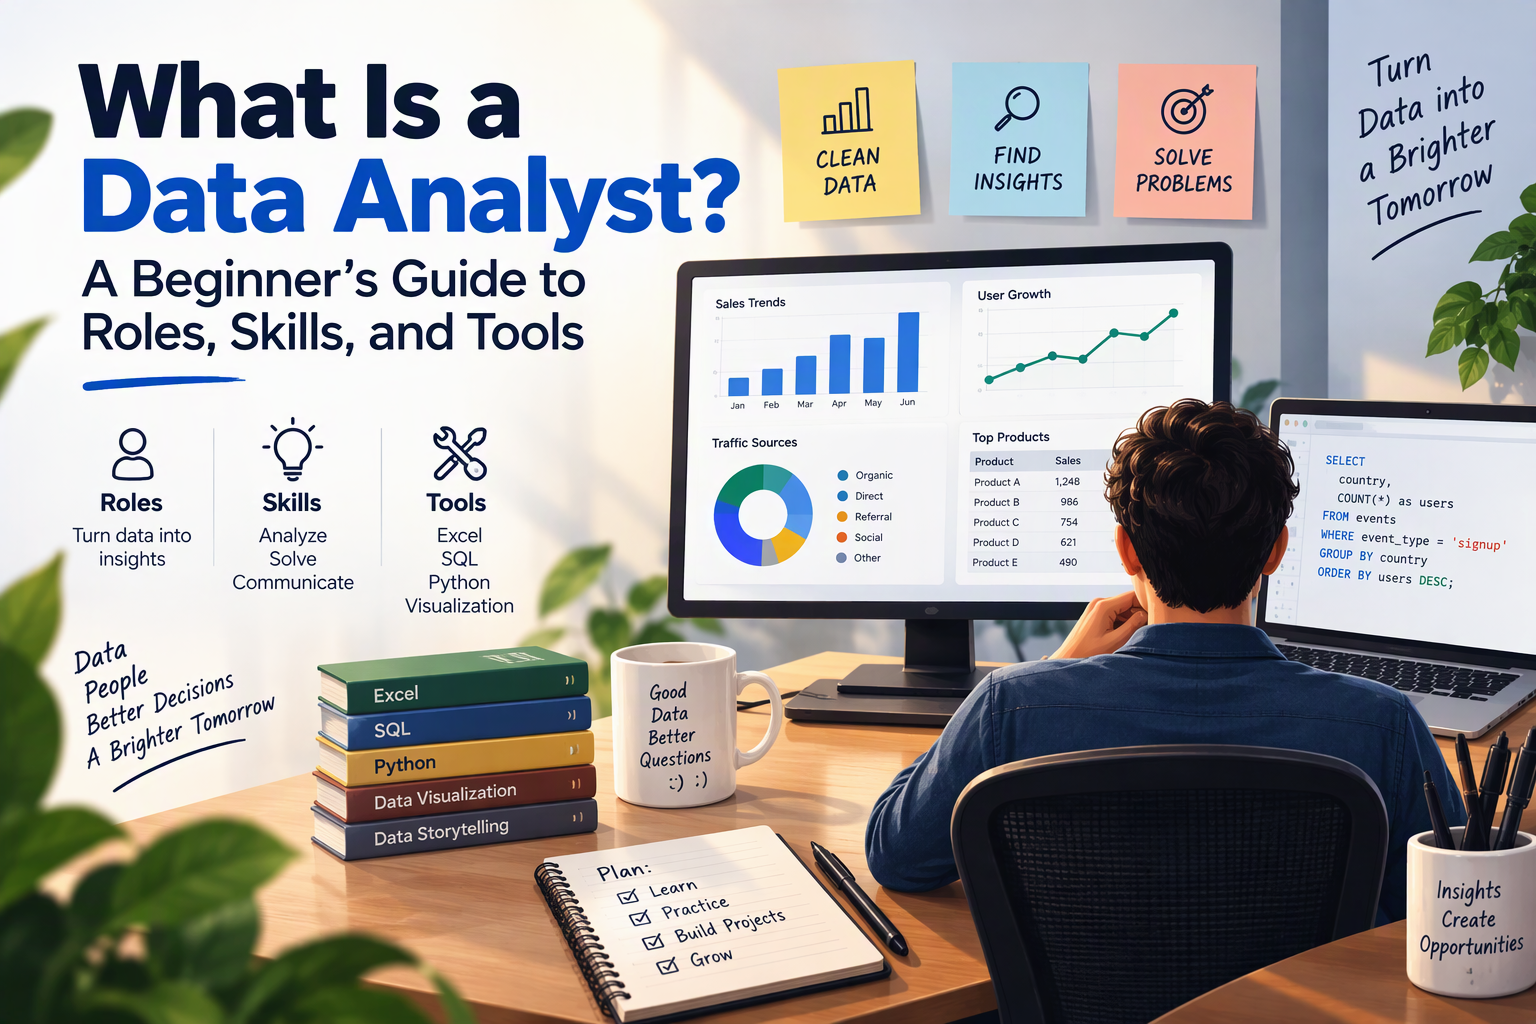
Every business collects data: sales, website visits, customer sign-ups, support tickets, inventory. But data on its own doesn’t answer anything. Someone has to turn it into answers to questions like “Why did sales drop last month?”, “Which customers are most likely to come back?”, or “Is the new marketing campaign working?”
That someone is a data analyst. In this guide, you’ll learn what data analysts do, how the role differs from similar jobs, which skills and tools they use, and how to start building a career as one, even if you’re starting from zero.
What Is a Data Analyst?
A data analyst collects, cleans, and analyzes data to help people make better decisions. In one sentence: a data analyst turns business questions into answers backed by data.
The work sits between the data and the people who need it. On one side are databases, spreadsheets, and exports from business systems. On the other are managers, marketing teams, finance departments, and business owners who need to decide what to do next. The analyst connects the two by finding the right data, making sense of it, and explaining what it means in plain language.
A good analyst doesn’t just report numbers (“revenue was $3,358.50 in February”). They add context (“that’s about eight times August’s revenue, and most of it came from our newer products”) and, when it’s useful, a recommendation (“let’s expand that product line”).
What Does a Data Analyst Do?
Most analysis projects, big or small, follow the same steps:
- Ask the question. Start with what the business needs to know, and make it specific. “How are we doing?” is too vague; “How has monthly revenue changed over the last six months?” is something you can answer.
- Collect the data. Find where the data lives (a database, a spreadsheet, a CRM, Google Analytics) and pull out what you need, often with SQL.
- Clean the data. Real data is messy: duplicates, missing values, typos, inconsistent dates. Cleaning often takes more time than the analysis itself. (See Cleaning Messy Data with Pure SQL and Data Cleaning with Python Pandas.)
- Analyze it. Calculate totals, averages, trends, and comparisons. Look for patterns and anything that seems off.
- Visualize it. Turn the results into charts and dashboards that people can understand at a glance.
- Communicate the findings. Present what you found, what it means, and what you recommend, to an audience that usually isn’t technical.
A typical week mixes recurring work (updating weekly sales dashboards, monthly reports) with ad hoc questions (“Can you find out why returns went up in March?”).
A Small Example
Here’s what step 4 can look like in practice. Imagine you work for a small online store, and your manager asks: “How is our revenue trending month to month?”
Using the same practice dataset from SQL and Data Science Interview Questions, an analyst might write a query like this:
SELECT
    strftime('%Y-%m', o.order_date) AS month,
    COUNT(DISTINCT o.order_id)      AS orders,
    SUM(oi.quantity * p.price)      AS revenue
FROM orders o
JOIN order_items oi ON oi.order_id  = o.order_id
JOIN products p     ON p.product_id = oi.product_id
WHERE o.status = 'completed'
GROUP BY month
ORDER BY month;
| month | orders | revenue |
|---|---|---|
| 2025-08 | 3 | 416 |
| 2025-09 | 4 | 438 |
| 2025-10 | 4 | 305 |
| 2025-11 | 11 | 2161.5 |
| 2025-12 | 9 | 2458 |
| 2026-01 | 7 | 792.5 |
| 2026-02 | 10 | 3358.5 |
(strftime is SQLite’s date-formatting function; PostgreSQL uses TO_CHAR(order_date, 'YYYY-MM') and MySQL uses DATE_FORMAT(order_date, '%Y-%m').)
The query is only half the job. The analyst’s real value is in what comes next:
- The finding: revenue jumped in November and has stayed much higher since, with a dip in January.
- The questions it raises: what changed in November? New products? More customers? A promotion? And is the January dip a seasonal pattern after the holidays, or a problem?
- The next step: break revenue down by product and by new vs. returning customers to find the cause, then share a short summary with a chart.
That cycle of question, query, finding, and next question is what data analysis looks like day to day.
Data Analyst vs. Data Scientist vs. Data Engineer
These job titles are often confused, and in small companies one person may do all three. Here’s how they usually differ:
| Role | Main question | Typical work | Key tools |
|---|---|---|---|
| Data analyst | What happened, and why? | Reports, dashboards, ad hoc analysis, explaining results | SQL, Excel, Power BI or Tableau, some Python |
| Data scientist | What will happen? | Predictive models, experiments, statistics, machine learning | Python or R, SQL, statistics, ML libraries |
| Data engineer | Is the data available and reliable? | Building pipelines, databases, and data warehouses | SQL, Python, cloud platforms, workflow tools |
| BI analyst / developer | How can everyone see the numbers? | Data models and dashboards for the whole company | Power BI, Tableau, SQL, DAX |
A simple way to remember it: data engineers build the roads, data analysts drive on them to find answers, and data scientists use them to predict where traffic is going. Many data scientists start as analysts, so the analyst role is also a common first step into the data field. (For an introduction to the prediction side, see What Is Machine Learning?.)
Types of Data Analysts
The core skills are the same everywhere, but the job title often names the area the analyst works in:
- Business analyst / business intelligence (BI) analyst: company-wide performance, KPIs, and dashboards.
- Marketing analyst: campaign results, website traffic, conversion rates, and customer segments.
- Financial analyst: budgets, forecasts, costs, and profitability.
- Operations analyst: supply chain, inventory, staffing, and process efficiency.
- Product analyst: how people use an app or website, and which features they adopt.
- Healthcare analyst: patient outcomes, hospital operations, and claims data.
- Education analyst: student enrollment, attendance, and performance data for schools and districts.
Knowing an industry well (its vocabulary, its metrics, its problems) makes you a much stronger analyst in it. If you already work in a field, that experience is an advantage, not something to leave behind.
Skills a Data Analyst Needs
Technical Skills
- SQL. The most important technical skill for an analyst, and the one tested in almost every interview. Most company data lives in databases, and SQL is how you get it out. Start with
SELECT,WHERE,GROUP BY, and joins, then move to subqueries and window functions. (See SQL JOINs Explained and SQL Window Functions.) - Spreadsheets. Excel and Google Sheets are everywhere. Learn formulas,
XLOOKUP(orVLOOKUP), pivot tables, and basic charts. - Data visualization. Choosing the right chart, and building dashboards that answer questions instead of just showing numbers. (See Power BI 101: Introduction to Visualization Charts.)
- Basic statistics. Averages, medians, percentages, distributions, correlation, and knowing when a difference is meaningful rather than random noise. You don’t need advanced math to start, but you do need to understand what your numbers mean.
- Python or R (a plus). Not required for every analyst job, but increasingly common. Python with Pandas handles data that’s too large or messy for a spreadsheet, and automates repetitive work. (Start with Python Basics, then Python for Data Analysis: Accessing Your Data.)
- Data modeling basics. Understanding how tables relate to each other makes everything else easier. (See Database Design: A Beginner’s Guide.)
Soft Skills
Technical skills get you the job; these make you good at it:
- Communication. Explaining a finding clearly to someone who doesn’t care how you got it. This is the skill that most separates great analysts from average ones.
- Curiosity. Asking “why?” one more time when a number looks strange.
- Business sense. Understanding what the business is trying to achieve, so you analyze what actually matters.
- Attention to detail. Catching the duplicate rows, the wrong date filter, or the total that’s suspiciously high before your manager does.
- Storytelling. Organizing results into a clear message: what happened, why it matters, and what to do about it.
Tools Data Analysts Use
| Category | Common tools | Used for |
|---|---|---|
| Spreadsheets | Excel, Google Sheets | Quick analysis, small datasets, sharing with non-technical teams |
| Databases & SQL | PostgreSQL, MySQL, SQL Server, SQLite | Storing and querying data |
| Cloud data warehouses | BigQuery, Snowflake, Amazon Redshift | Querying very large datasets |
| BI & dashboards | Power BI, Tableau, Looker Studio | Interactive dashboards and reports |
| Programming | Python (Pandas, NumPy, Matplotlib), R | Cleaning, analysis, automation, charts |
| Notebooks | Jupyter, Google Colab | Writing and sharing analysis step by step |
| Version control | Git, GitHub | Tracking changes to queries and code, sharing projects |
You don’t need to learn all of these. A strong starting set is SQL + Excel + one BI tool (Power BI or Tableau). Add Python once you’re comfortable with those. If you’re curious about specific tools, see PostgreSQL for Beginners, DAX Functions Every Power BI Analyst Should Know, and Python Data Visualization.
How to Become a Data Analyst
There’s no single path into the role. People come from business, education, healthcare, IT, and many other fields. Here’s a practical order to learn in:
- Get comfortable with spreadsheets. Formulas, sorting and filtering, pivot tables, and charts. Many real analyst tasks still start and end in Excel.
- Learn SQL. Practice on real datasets until you can write joins and aggregations without looking anything up. The SQL interview practice guide includes a free dataset to practice with.
- Learn a BI tool. Build a few dashboards in Power BI or Tableau. Both have free versions.
- Learn basic statistics. Focus on descriptive statistics, distributions, and how to compare groups fairly.
- Add Python. Pandas for cleaning and analysis, Matplotlib or Seaborn for charts. (See Python NumPy: A Complete Guide for the foundation Pandas is built on.)
- Build a portfolio. This matters more than certificates. Pick two or three public datasets on topics you care about and complete a full project for each: question, cleaning, analysis, charts, and a written summary of the findings. Put them on GitHub or a personal website.
- Practice explaining your work. For each project, write a short summary a non-technical reader could follow. That’s exactly what interviewers want to see.
- Apply, and look inside your current job. Many people become analysts by taking on data tasks where they already work: building the team’s report, automating a spreadsheet, answering a question nobody else could.
Certificates (such as the Google Data Analytics Certificate or Microsoft’s Power BI Data Analyst certification) can help structure your learning and get your resume noticed, but a portfolio of real projects is what proves you can do the work.
Frequently Asked Questions
Do I need a degree to become a data analyst? Not always. Many employers list a bachelor’s degree, often in business, statistics, economics, or computer science, but plenty hire based on skills and a strong portfolio. A degree helps; demonstrated ability matters more.
Do I need to know how to code? SQL, yes. It’s essential for almost every analyst job. Python or R are a plus that opens more doors, but many analyst roles focus on SQL, Excel, and BI tools.
How much math do I need? Less than most people expect. Comfort with percentages, averages, and basic statistics is enough to start. More advanced statistics becomes important if you move toward data science.
How long does it take to learn? It depends on your starting point and how much time you can give it. With consistent practice, many people learn enough SQL, Excel, and one BI tool to build a portfolio in several months.
Is data analysis a good career? Data skills are useful in almost every industry, and the analyst role leads naturally to others: senior analyst, analytics manager, data scientist, or data engineer, depending on what you enjoy most.
Conclusion
A data analyst turns raw data into answers people can act on. The job combines technical skills (SQL, spreadsheets, visualization, and often Python) with human skills (curiosity, business sense, and clear communication), and it’s one of the most accessible ways into the data field.
The best way to find out if it’s for you is to try it. Pick a question you’re curious about, find a dataset, and work through the full cycle: ask, collect, clean, analyze, visualize, and explain. Then do it again with a harder question. That’s the job, and every project you finish is one more piece of your portfolio.